
How to read trade history
The main teaching material you already have.
Pull patterns of behaviour out of the trade history rather than just a balance total.
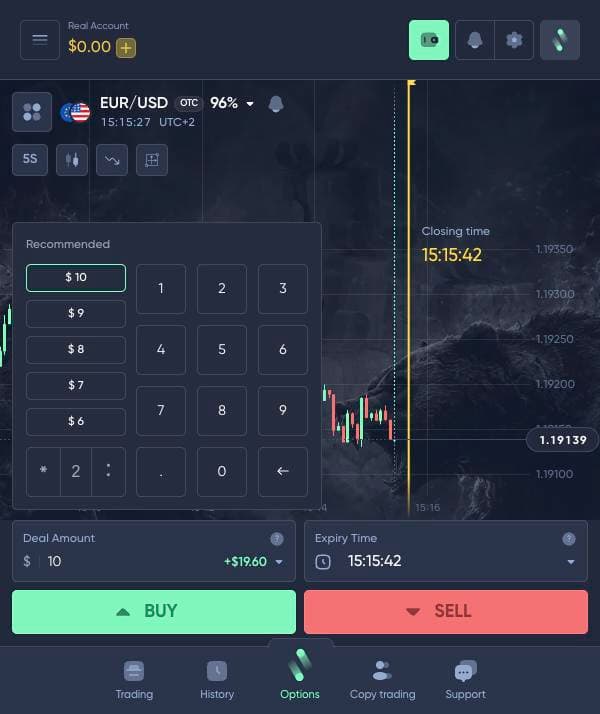
The trade history shows the instrument, the time, the amount, the direction and the result. Most people look there only to see the total — and miss the most valuable part.
- Whether the amount grew after losses
- Whether there was a run of clicks within a few minutes
- Which instruments give the worst statistics
- At what hour most mistakes happen
- How many trades had no recorded reason
Each of these is a pattern of behaviour that is only visible across a distance. It cannot be noticed inside a day, when decisions are taken one after another.
The clearest marker is the gaps in time between trades. If they shrink to a few minutes, decisions were being made without analysis and the pace was set by emotion.
The platform's history keeps what you did. The journal keeps why. Together they give the full picture — separately each half is nearly useless.
The usual mistake
Opening the history, seeing “−$12 for the day” and closing it — without noticing that all six trades were opened inside fifteen minutes.
Key takeaways
- The history shows patterns of behaviour, not only a total.
- Shrinking gaps between trades are a marker of emotional trading.
- History plus journal give the full picture: what, and why.
A note from Leon Mercer Academy
Once a week, pull three numbers out of the history: the average trade size, the number of trades and the longest gap without one. How those numbers move shows your state better than profit does.
A practical example
Take your last 20 trades and write out two columns: the time of opening and the size.
If the time column has clusters of three or four trades inside ten minutes, and the size column shows jumps, that is a portrait of an emotional session, whatever the result.
Lesson 11 of 15 in “YOUR FIRST TRADE”